Estimating the Greenhouse Gas Emissions of Flood Damages
Sebastian Rowan1,2, Elissa Yeates2, Weiwei Mo1
1 Department of Civil and Environmental Engineering, University of New Hampshire; 2 Coastal and Hydraulics Laboratory, Engineer Research and Development Center, U.S. Army Corps of Engineers
Overview
Problem: The effects of floods and storms on greenhouse gas (GHG) emissions are not well-understood, and planners lack tools to incorporate them into decision-making for flood risk management (FRM) projects. A method to estimate the GHG emissions associated with flood events is needed to develop more sustainable FRM strategies.
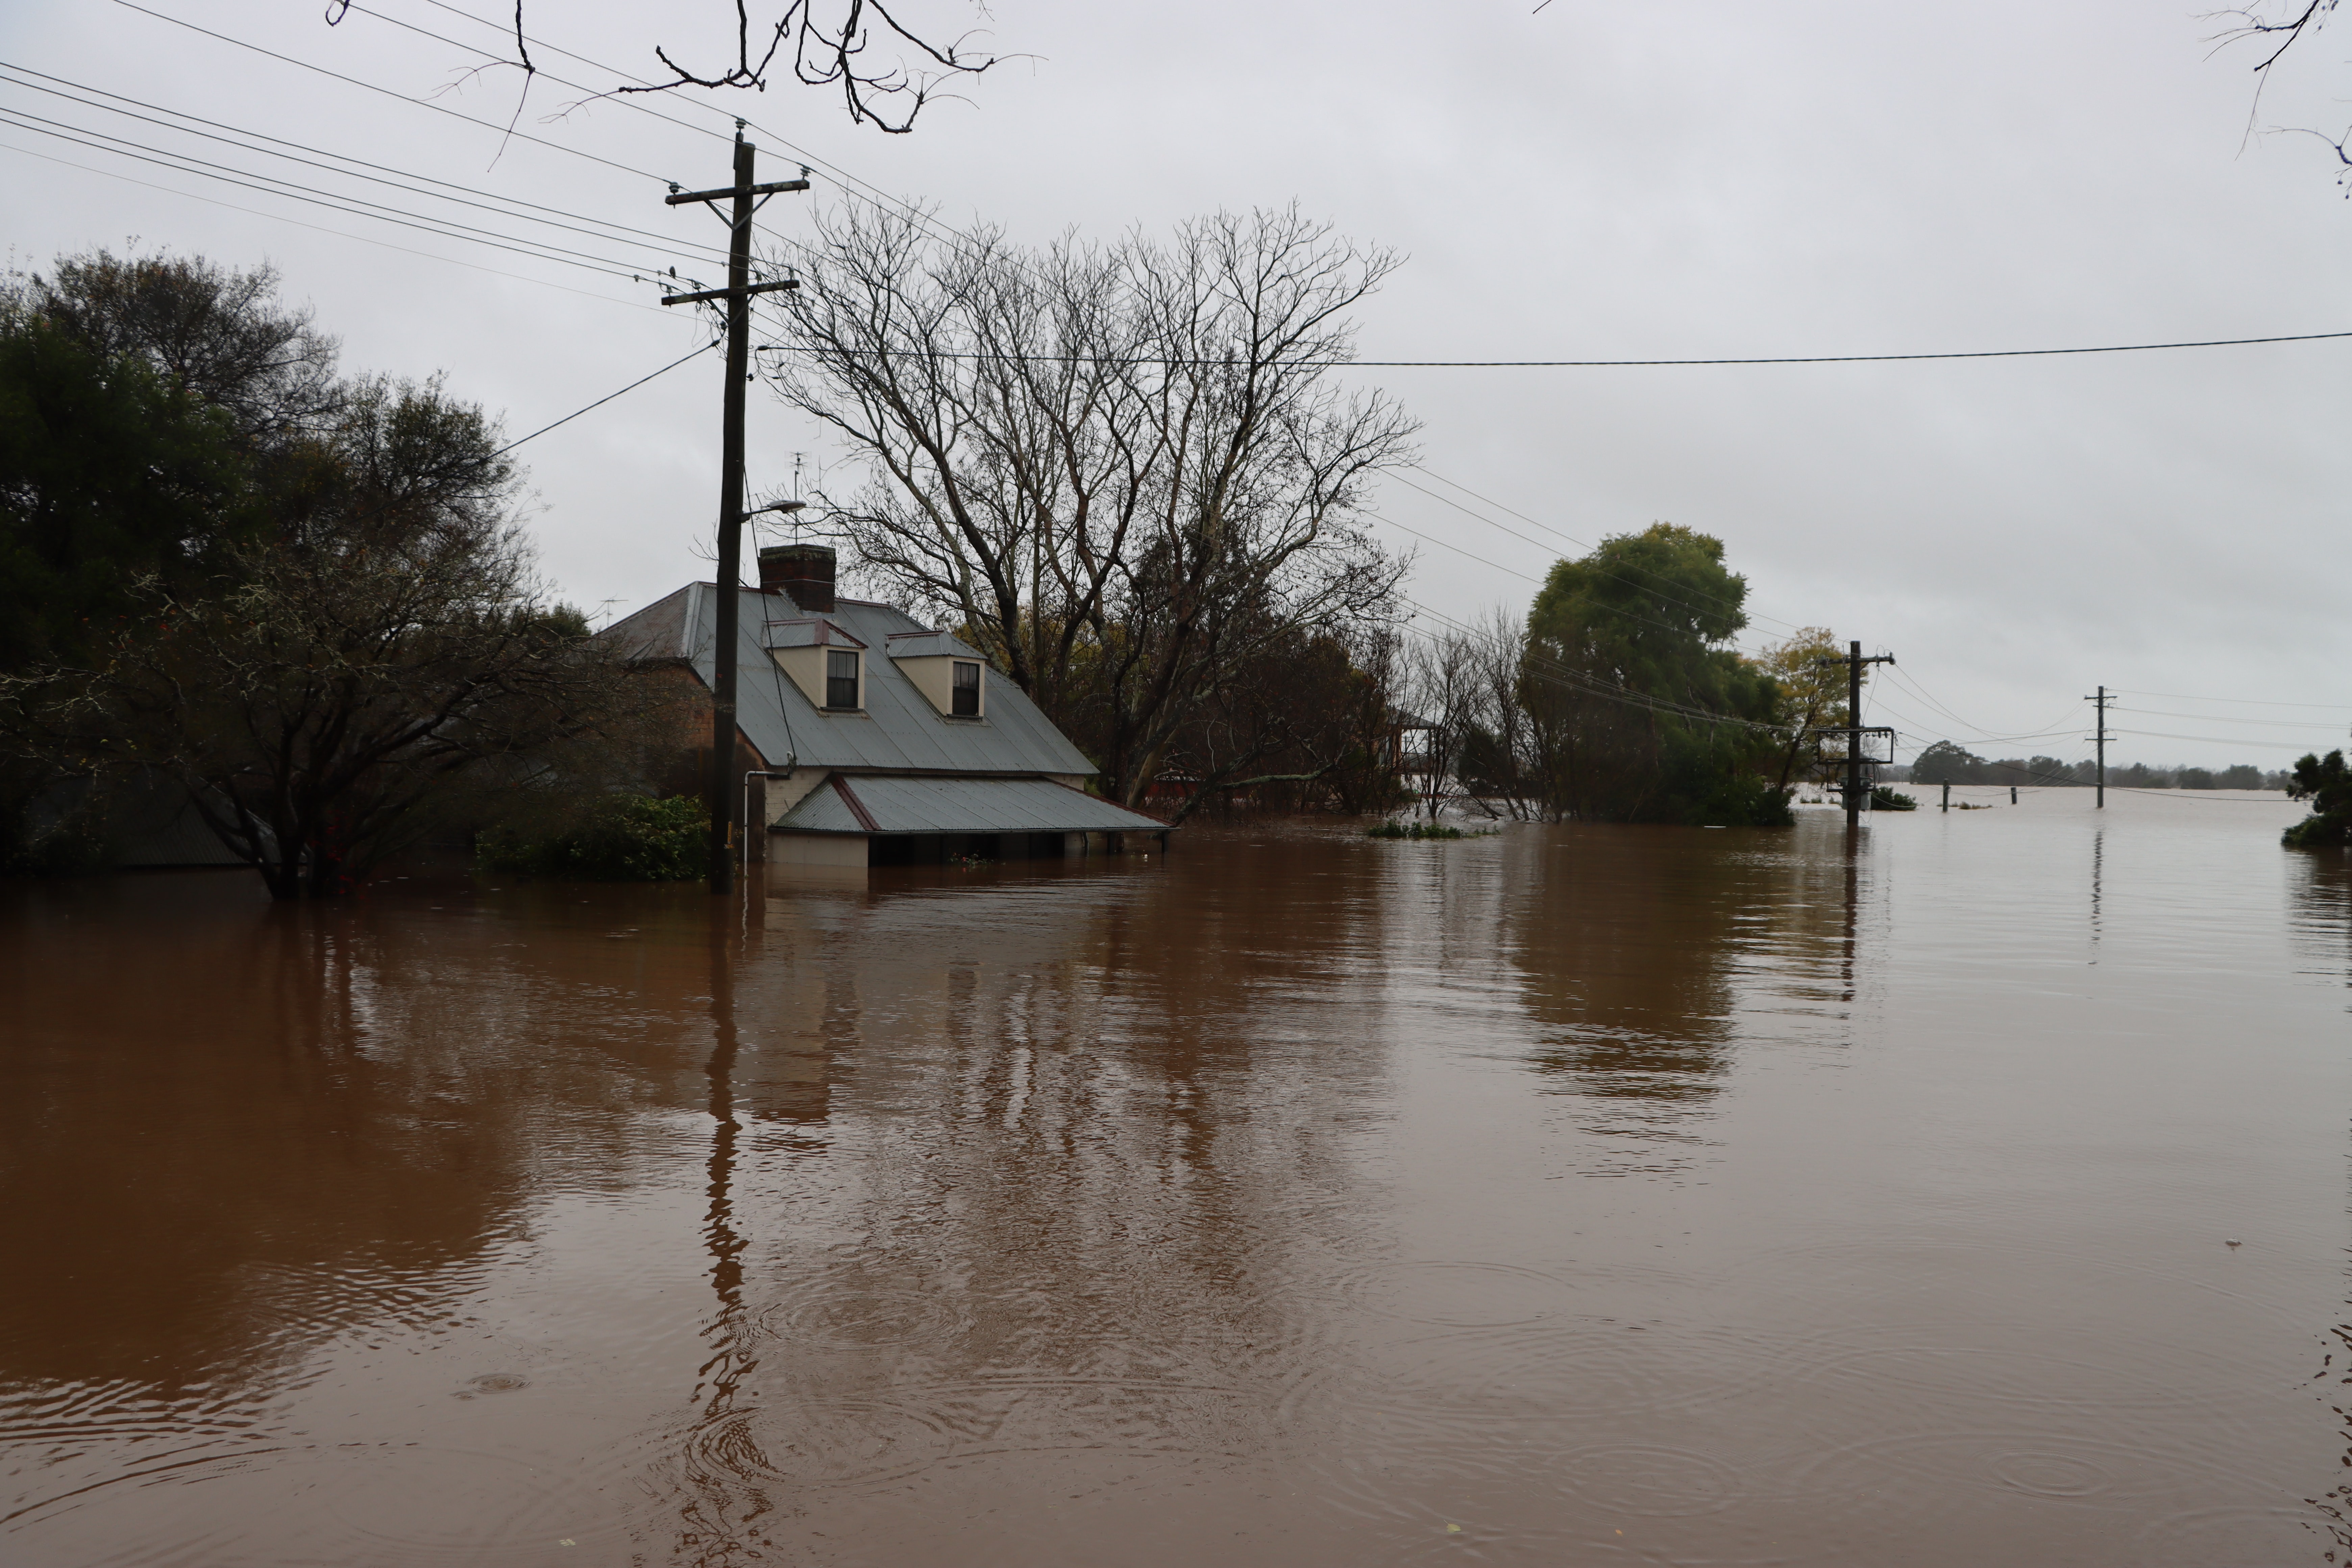 Photo by
Wes Warren on
Unsplash
Photo by
Wes Warren on
Unsplash
Objective: Develop and demonstrate a framework to estimate the life-cycle GHG emissions that result from repairing flood damages to single-family residential structures.
Methods: Use component-level depth-damage estimates to generate economic demand vectors for five residential structure types across a range of flood depths. Input demand vectors into U.S. EPA’s USEEIO LCIA model to produce structure-level depth-emissions curves for each structure type. Apply framework to Mississippi River Valley case study.
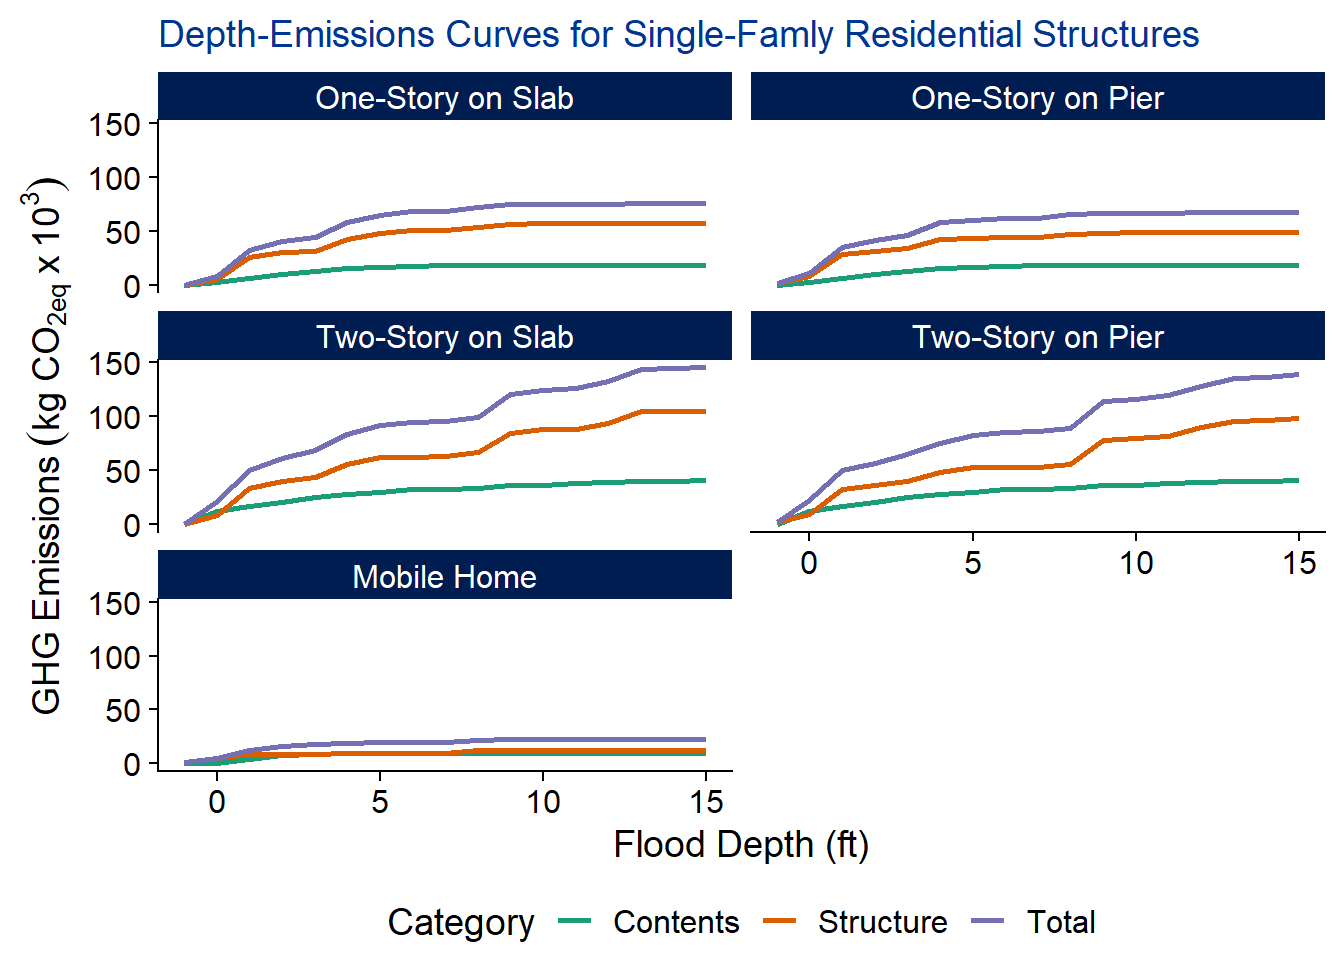
Results: Depth-emissions curves were produced for five residential structure types. Case study results show that damages from the 100-year flood could produce 1.85 - 2.66 x 10⁸ kg CO2eq in the Burlington-Davenport region and 1.11 - 3.01 x 10⁸ kg CO2eq in the Paducah-Cairo region.
Data and Methods
Depth-Emissions Curves
Depth-damage estimates for contents and structural components for 5 residential structure types gathered from USACE report produced based on data from 39 homeowner surveys and panel of 9 industry experts1. We mapped items to specific industry with NAICS code and aggregated damage cost values by code to produce an economic demand vector for each flood depth.
| Sample Expert Opinion Depth-Damage Estimates for One-Story on Pier Structure | ||||||||||
| Contents | ||||||||||
|---|---|---|---|---|---|---|---|---|---|---|
| Bookcase/Entertainment Center | ||||||||||
| Couch/Sofa | ||||||||||
| Stereo Equipment | ||||||||||
| Tables/Chairs | ||||||||||
| Structure | ||||||||||
| Bottom Cabinets | ||||||||||
| Exterior Wall/Siding | ||||||||||
| Structural Frame | ||||||||||
| Wall Insulation | ||||||||||
USEEIO Model v2.0 developed by U.S. EPA was used to estimate the GHG emissions produced by the economic activity specified by a demand vector2. We input demand vectors for flood depths from -1 to 15ft relative to first floor elevation (FFE) into the USEEIO model to produce depth-emissions curves for each structure type.
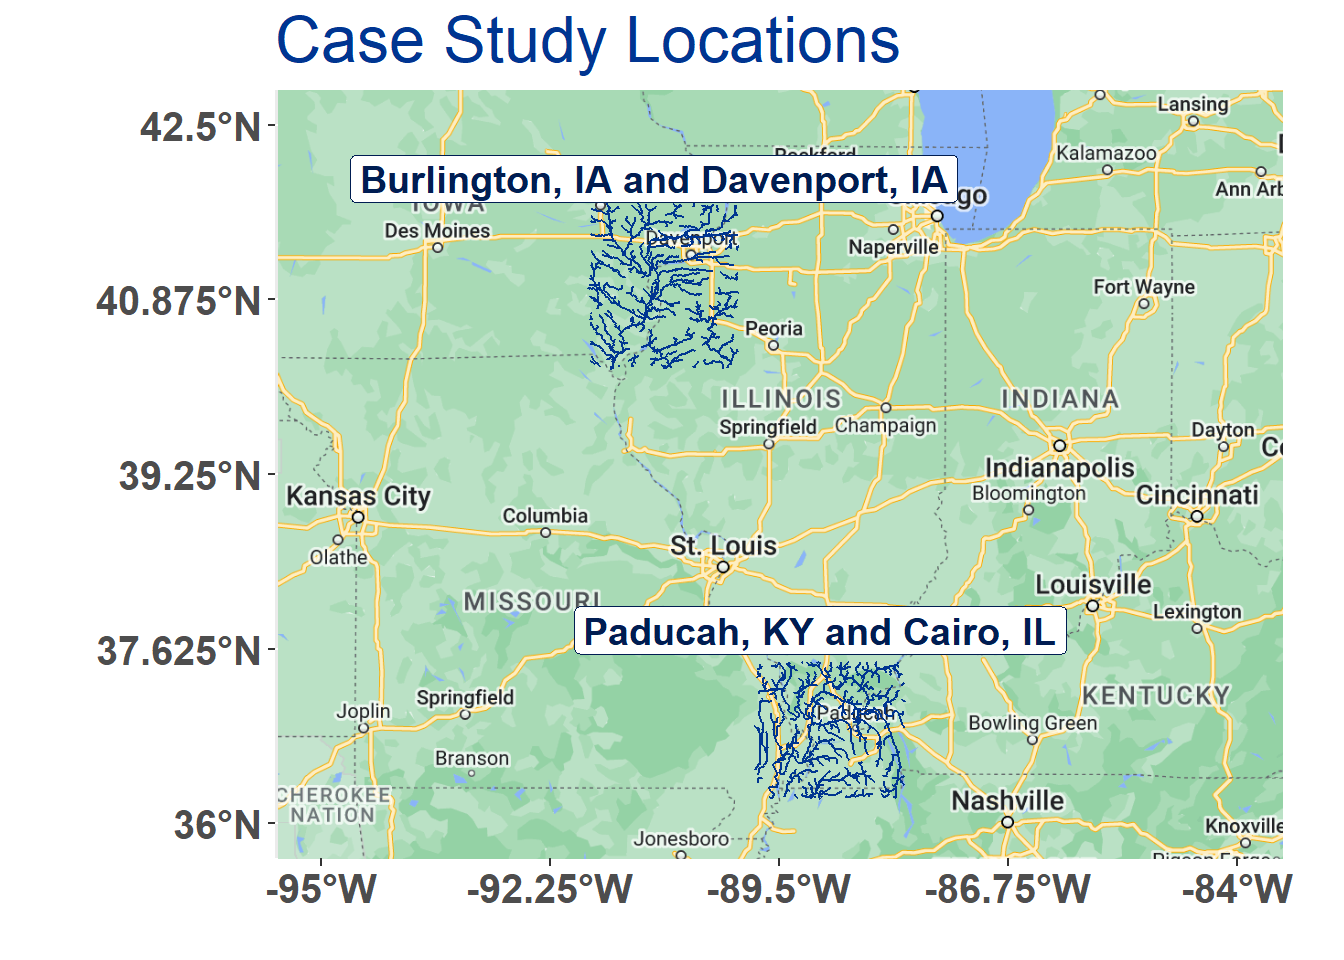
Case Study
| Study Area Residential Structures Stats | |||
| Burlington, IA and Davenport, IA | |||
|---|---|---|---|
| One Story | |||
| Two Story | |||
| Three Story | |||
| Mobile Home | |||
| Paducah, KY and Cairo, IL | |||
| One Story | |||
| Two Story | |||
| Three Story | |||
| Mobile Home | |||
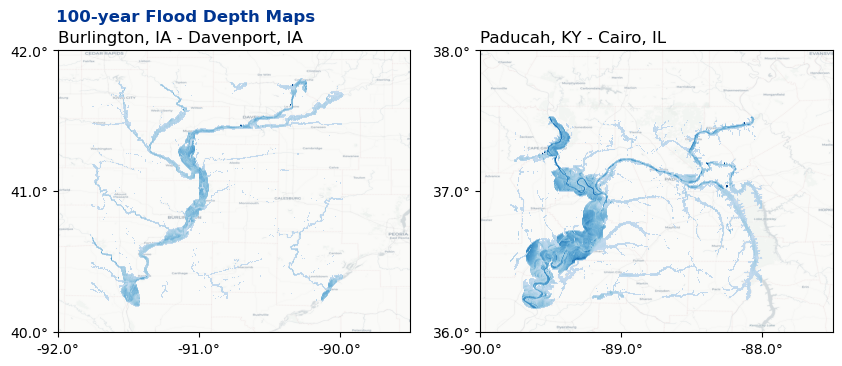
Autoroute/FloodSpreader was used to generate 100-year flood depth grid for each location using minimum, maximum, and
mean stream flow estimates3.
 National Structures Inventory used to determine location, elevation, and structure type of residential buildings.
We used the depth grids to determine flood depth at each structure in the study area, and applied the appropriate depth-emissions curve to determine the GHG emissions associated with the damage.
Results
| Damage-induced GHG emissions by flood depth (kg CO2eq x 103) | |||||||||||||||||
| Flood depth relative to first floor elevation (ft) | |||||||||||||||||
|---|---|---|---|---|---|---|---|---|---|---|---|---|---|---|---|---|---|
| -1 | 0 | 1 | 2 | 3 | 4 | 5 | 6 | 7 | 8 | 9 | 10 | 11 | 12 | 13 | 14 | 15 | |
| Mobile Home | |||||||||||||||||
| Structure | 1.73 | 5.17 | 8.31 | 8.86 | 9.02 | 9.47 | 9.80 | 9.82 | 9.93 | 12.23 | 12.61 | 12.76 | 12.76 | 12.76 | 12.76 | 12.76 | 12.76 |
| Contents | 0.00 | 0.01 | 4.00 | 7.41 | 8.55 | 9.34 | 9.67 | 9.83 | 9.89 | 9.89 | 9.89 | 9.89 | 9.89 | 9.89 | 9.89 | 9.89 | 9.89 |
| Total | 1.73 | 5.18 | 12.31 | 16.27 | 17.58 | 18.81 | 19.47 | 19.65 | 19.82 | 22.12 | 22.50 | 22.65 | 22.65 | 22.65 | 22.65 | 22.65 | 22.65 |
| One-Story on Pier | |||||||||||||||||
| Structure | 1.18 | 8.32 | 28.82 | 31.14 | 33.58 | 42.59 | 43.42 | 43.92 | 44.03 | 47.06 | 48.33 | 48.51 | 48.64 | 48.71 | 48.80 | 48.87 | 48.97 |
| Contents | 0.00 | 2.08 | 6.44 | 9.84 | 12.58 | 15.39 | 16.49 | 17.72 | 17.98 | 18.12 | 18.17 | 18.17 | 18.17 | 18.17 | 18.17 | 18.17 | 18.17 |
| Total | 1.18 | 10.40 | 35.26 | 40.98 | 46.15 | 57.98 | 59.91 | 61.64 | 62.01 | 65.18 | 66.49 | 66.68 | 66.81 | 66.88 | 66.97 | 67.04 | 67.14 |
| One-Story on Slab | |||||||||||||||||
| Structure | 0.00 | 5.51 | 26.05 | 30.22 | 31.24 | 42.58 | 48.12 | 50.27 | 50.33 | 53.46 | 56.60 | 56.94 | 57.00 | 57.00 | 57.21 | 57.21 | 57.21 |
| Contents | 0.00 | 2.08 | 6.44 | 9.84 | 12.58 | 15.39 | 16.49 | 17.72 | 17.98 | 18.12 | 18.17 | 18.17 | 18.17 | 18.17 | 18.17 | 18.17 | 18.17 |
| Total | 0.00 | 7.59 | 32.49 | 40.06 | 43.82 | 57.97 | 64.61 | 67.99 | 68.31 | 71.58 | 74.77 | 75.10 | 75.16 | 75.16 | 75.38 | 75.39 | 75.39 |
| Two-Story on Pier | |||||||||||||||||
| Structure | 2.26 | 9.50 | 32.92 | 36.01 | 39.71 | 47.82 | 52.54 | 52.93 | 53.21 | 55.58 | 77.71 | 80.01 | 81.92 | 89.51 | 95.51 | 96.48 | 98.14 |
| Contents | 0.06 | 12.37 | 16.76 | 20.70 | 24.86 | 27.51 | 30.12 | 32.36 | 32.85 | 33.11 | 36.11 | 36.11 | 37.89 | 38.78 | 39.55 | 40.21 | 40.55 |
| Total | 2.32 | 21.87 | 49.68 | 56.71 | 64.57 | 75.34 | 82.66 | 85.28 | 86.06 | 88.68 | 113.82 | 116.12 | 119.81 | 128.28 | 135.06 | 136.68 | 138.69 |
| Two-Story on Slab | |||||||||||||||||
| Structure | 0.00 | 8.78 | 33.26 | 40.10 | 43.94 | 55.96 | 61.92 | 62.49 | 62.60 | 66.34 | 84.15 | 87.70 | 88.33 | 93.54 | 104.46 | 104.46 | 104.54 |
| Contents | 0.06 | 12.37 | 16.76 | 20.70 | 24.86 | 27.51 | 30.12 | 32.36 | 32.85 | 33.11 | 36.11 | 36.11 | 37.89 | 38.78 | 39.55 | 40.21 | 40.55 |
| Total | 0.06 | 21.15 | 50.02 | 60.80 | 68.81 | 83.47 | 92.04 | 94.85 | 95.45 | 99.45 | 120.26 | 123.81 | 126.22 | 132.31 | 144.01 | 144.66 | 145.09 |
| Lifecycle GHG Emissions From 100-Year Flood Damages (kg CO2eq) | |||
| Streamflow estimate scenario | |||
|---|---|---|---|
| MIN | MEAN | MAX | |
| burlington-davenport | 1.85 × 10⁸ | 2.27 × 10⁸ | 2.66 × 10⁸ |
| paducah-cairo | 1.12 × 10⁸ | 1.71 × 10⁸ | 3.01 × 10⁸ |
Discussion
The framework demonstrated here provides FRM planners a method to rapidly extend traditional flood risk assessments to include life-cycle GHG emissions. The USEEIO LCIA approach also allows planners to incorporate other economic impacts such as lost business revenue that can be formatted as a demand vector. The model currently appears to be greatly overestimating the GHG emissions that would be induced by the flood damages.
The maximum estimated GHG emissions per building area produced by the model are about twice the average estimated embodied carbon for new construction homes4. Next steps include refining model parameters to address possible causes of overestimation, expanding the framework to incorpore demand reductions due to business down time, and expanding the case study to include LCIA possible FRM project alternatives.
References
Funding: This research was supported in part by an appointment to the Department of Defense (DOD) Research Participation Program administered by the Oak Ridge Institute for Science and Education (ORISE) through an interagency agreement between the U.S. Department of Energy (DOE) and the DOD. ORISE is managed by ORAU under DOE contract number DE-SC0014664. All opinions expressed in this paper are the authors’ and do not necessarily reflect the policies and views of DOD, DOE, or ORAU/ORISE.